Link to paper
The full paper is available here.
You can also find the paper on PapersWithCode here.
Abstract
- Number of international benchmarking competitions in ML increasing
- Survey conducted to understand development of algorithms in biomedical imaging
- 70% of participants motivated by knowledge exchange, 16% by prize money
- 80 working hours spent on method development, 32% didn’t have enough time
- 25% perceived infrastructure to be a bottleneck
- 94% of solutions deep learning-based, 84% based on standard architectures
- 43% of data samples too large to process at once, addressed by patch-based training, downsampling, and solving 3D analysis tasks as a series of 2D tasks
- K-fold cross-validation on training set performed by 37%, 50% performed ensembling
- 48% applied postprocessing steps
Paper Content
Purpose
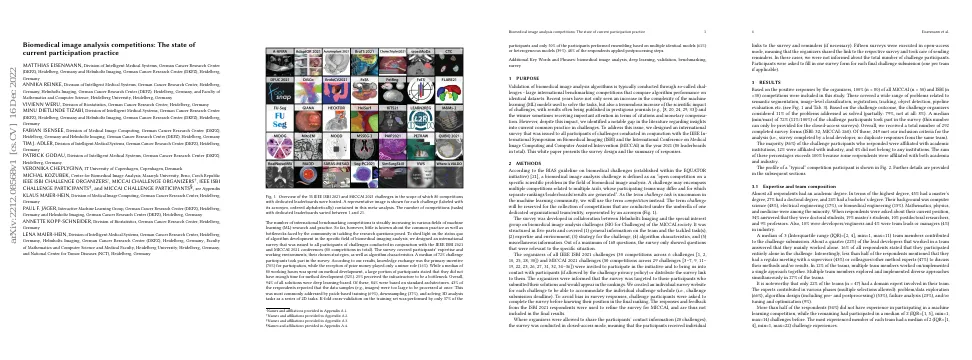
- Validation of biomedical image analysis algorithms is conducted through challenges.
- Challenges compare algorithm performance on identical datasets.
- ML models used to solve tasks have increased in complexity.
- Challenges have increased in scientific impact.
- Results are often published in prestigious journals.
- Survey was issued to participants of challenges in 2021.
Methods
- BIAS guideline defines a biomedical image analysis challenge as an open competition on a scientific problem
- Survey was developed by Helmholtz Imaging and the SIG for Challenges of the MICCAI society
- Survey was structured in 5 parts and covered general information, expertise and environment, strategy, algorithm characteristics, and miscellaneous information
- Survey was sent to organizers of IEEE ISBI 2021 and MICCAI 2021 challenges
- Survey was conducted in closed-access or open-access mode
Results
- 80 competitions included in the study
- 11% of problems addressed were considered solved
- 292 survey forms completed, 249 met inclusion criteria
- 86% of respondents affiliated with academic institutions, 12% with industry, 4% with no institution
Expertise and team composition
- Almost all respondents had an academic degree
- 45% had a master’s degree, 27% had a doctoral degree, and 24% had a bachelor’s degree
- Backgrounds were computer science (48%), electrical engineering (17%), or biomedical engineering (15%)
- 34% were doctoral students, 19% master’s students, 10% postdoctoral researchers, and 9% professors
- 10% were developers/engineers and 4% were team leads or managers
- Median of 3 team members contributed to the challenge submission
- 22% of lead developers worked alone, 16% participated entirely alone
- 43% had regular meetings with supervisors, 47% with colleagues/method experts
- 12% of teams had multiple members working on/implementing a single approach
- 27% of teams had multiple members exploring/implementing diverse approaches
- 22% of teams had a domain expert involved
- 54% of respondents had no experience in machine learning competitions
- Most experienced member had a median of 2 challenge experiences
- 49% rated their experience with similar tasks as moderately/extremely familiar
- 65% felt moderately/extremely familiar with similar methods
- 64%, 64%, and 54% felt moderately/extremely familiar with similar datasets
- 48% of team members rated other team members as moderately/extremely familiar with similar tasks
- 50% rated other team members as moderately/extremely familiar with similar methods
- 61%, 64%, and 58% rated other team members as moderately/extremely familiar with similar datasets
- 25% thought infrastructure was a bottleneck
- 92% used GPU resources
- Total training time of all models was a median of 267 GPU hours
- Total training time of final model was a median of 24 GPU hours
- Python was the main programming language (96%)
- Top low-level, core, and high-level libraries were PyTorch (76%), NumPy (74%), NiBabel (34%), SimpleITK (33%), and torchvision (29%)
Strategy for the challenge
- Knowledge exchange was the most important incentive for participation
- Possibility to compare own method to others was second most important incentive
- Awards/prize money was important to only 16% of respondents
- Median time of 2.5 weeks prior to submission deadline
- 60 working hours (median) spent prior to decision to submit results
- Most work dedicated to method development, running baseline method, analyzing data/annotations, hyperparameter tuning, literature research, failure case analysis, challenge design
- 42% of respondents based approach on existing work, 15% reimplemented closest reference method
- Half of respondents reimplemented a method based on a publication
- 57% used code base of baseline method
- 94% used deep learning-based approach
- Most time spent on selecting/configuring architecture, data augmentation, exploring loss functions, ensembling
- 17% explored additional data
- 38% expected substantial performance boost with more time
Algorithm characteristics
- 9% of deep learning-based approaches used additional data
- Types of data used included biomedical data from public and private datasets, and non-biomedical data from public datasets
- Additional data was used for pre-training and co-training
Network topology.
- 84% of networks based on common computer vision architecture
- 33% of networks pre-trained on another image dataset
- Median of 7.8 million trainable parameters
- Median of 10 hyperparameter combinations explored
- 13% used architecture search to find final network
- 80% used matching architecture type, 5% used non-standard approach
- 57% modified architecture to improve performance
- 71% took challenge metrics into account while searching for hyperparameters
- 80%, 66%, 44%, 43% used data augmentation, batch normalization, dropout, weight decay to avoid overfitting
- 85% used data augmentation
- 43% reported data samples too large to process at once
- 69% used patch-based training, 37% used downsampling, 18% used 3D analysis as series of 2D analysis tasks, 5% used time-lapse analysis as series of single-frame analysis tasks
- 39% used cross-entropy loss, 32% used combined CE and Dice loss, 26% used Dice loss, 9% used custom-designed loss, 5% used MSE loss
- 29% used early stopping, 12% used warmup
- 52% used single train:val(:test) split, 37% used K-fold crossvalidation
Ensemble methods.
- Half of the respondents used a single model trained on all available data
- 6% proposed an ensemble of multiple identical models, each trained on the full training set
- 21% proposed an ensemble of multiple identical models, each trained on a randomly drawn subset of the training set
- 9% ensembled multiple different models, each trained on the whole training set
- 8% ensembled multiple different models, each trained on a randomly drawn subset of the training set
- Median of 5 models used in final solution, max of 21 models
- 48% of respondents applied postprocessing steps
Outlook
- Conducted international survey on biomedical challenges
- Linking strategies of teams to challenge ranking to determine why winner is best