Link to paper
The full paper is available here.
You can also find the paper on PapersWithCode here.
Abstract
- Choosing the parameter k for k-means clustering is a challenge
- The elbow method is a common heuristic, but it is not reliable
- Better alternatives have been known for a long time
- Educators should discuss the problems of the elbow method and teach alternatives
- Researchers and reviewers should reject conclusions drawn from the elbow method
Paper Content
Introduction
- Cluster analysis is used to identify subgroups in data
- No single definition of a cluster exists
- Different algorithms are used to find the best solution
- K-means clustering is the most used and taught clustering method
- K-means is simple and runs quickly
- Choosing the number of clusters is a key problem with k-means
K-means clustering
- K-means clustering is a least-squares optimization problem.
- It is a data quantization technique that approximates a data set of N objects in a continuous, d-dimensional vector space.
- The standard algorithm has a complexity of O(N kdi).
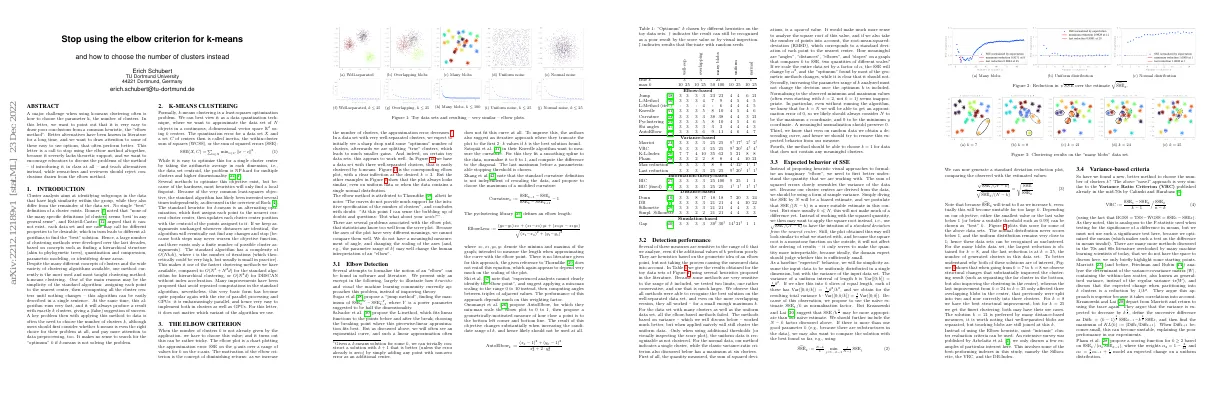
The elbow criterion
- Choosing the number of clusters (k) can be tricky
- Elbow plot is a chart plotting the approximation error SSE on the y-axis over a range of values for k on the x-axis
- Elbow method attributed to Thorndike
- Problems associated with elbow plot
Elbow detection
- Several attempts to formalize the notion of an “elbow” have been made in software and literature.
- Sugar et al. proposed a “jump method” to find the max- where Y is a power parameter.
- Salvador et al. proposed the L-method, which fits linear functions to the points before and after the break.
- Satopää et al. proposed the Kneedle algorithm to measure the curvature.
Detection performance
- Heuristics based on the geometric idea of an elbow point
- Table 1 gives results for toy data sets
- Heuristics sensitive to range of k analyzed
- Root-mean-squared deviation (RMSD) more meaningful than SSE
- Normalizing should preserve 0
- Method should be able to choose k = 1 for data without meaningful clusters
Expected behavior of sse
- We need to better understand the quantity we are working with
- We should use a form of sample variance
- We should use the square root of the quantity to make it more interpretable
- We assume the input data is uniformly distributed in a single dimension
- We propose to use the naïve estimate SSE1 /k as normalization factor
- We can generate a standard deviation reduction plot to compare observed and estimated values
- We can use cluster evaluation criteria such as Silhouette, VRC, and DB-Index
Variance-based criteria
Distance-based criteria
- Dunn index compares the diameter of clusters to the cluster separation
- Davies-Bouldin-Index compares the distance to the nearest other cluster with the radius of the two clusters
- Average silhouette width measure compares the average distance of each point to its own cluster to the average distance to the nearest other cluster
Information-theoretic criteria
- Principle of minimum description length is used to choose optimum number of clusters
- Increasing number of centers means data is approximated more closely and more cluster centers need to be stored
- X-means and G-means algorithms use Bayesian Information Criterion and Anderson-Darling tests respectively to decide when to accept a new cluster
- K-means does not minimize Euclidean or Manhattan distance, but is often good enough for many applications
Simulation-based criteria
- Gap statistic estimates baseline SSE k by clustering uniform random data sets
- Gap statistic chooses k by comparing Gap k and Gap k−1 −s k+1
- Gap statistic works decently well for synthetic data, but not for uniform data
- Estimated number of clusters is unstable with default sample sizes
- Suggest using VRC, BIC, or Gap statistic to choose k
- Pay attention to preprocessing data for k-means
The true challenges of k-means
- Choosing the parameter k is difficult for the user
- Obtaining meaningful results from k-means is harder than expected
- k-means assumes errors are the same across the data space
- k-means assumes clusters have the same spherical shape
- k-means does not work well in certain situations
- k-means is not suitable for complex data
Conclusion
- Elbow method is commonly used in education, online media, and clustering research
- Alternatives such as VRC, BIC, and Gap statistics should be preferred
- Problems of elbow approach have been discussed in literature
- Educators should omit the method or explain better alternatives
- Data scientists should not rely on evaluation measures to determine “best” solution