Link to paper
The full paper is available here.
You can also find the paper on PapersWithCode here.
Abstract
- The effective brain connectome (EBC) is important for understanding information processing in the brain.
- A comprehensive mapping of the human EBC has not been achieved.
- A data-driven computational framework called Neural Perturbational Inference (NPI) is used to derive the human EBC.
- The NPI-inferred human EBC reveals log-normally distributed strengths of both excitatory and inhibitory connections.
- The EBC sheds light on the structure-function relationship in the brain and offers theoretical guidance for personalized neurostimulation.
Paper Content
Introduction
- Brain is a complex network of interconnected regions
- Regions process information from environment and body
- Information is hierarchically transmitted among regions
- Structural connectivity (SC) maps physical connections between brain regions
- Functional connectivity (FC) examines statistical associations between regional neural signals
- SC provides static structural basis for functional interactions
- FC lacks directionality and cannot distinguish between directed and indirect interactions
- Effective connectivity (EC) describes how a particular brain region affects its downstream brain regions
- EC depends on SC and nonlinear brain dynamics
- Effective brain connectome (EBC) needed to understand information processing pathway
- Neurostimulation-based methods used to study EC
- Model-based and model-free approaches used to infer EC from neural signals
- Data-driven methods, particularly deep learning, used to fit and predict brain dynamics
- Neural Perturbational Inference (NPI) used to noninvasively infer EBC from fMRI data
- Inferred EBC exhibits desired properties: direction, strength, excitatory-inhibitory distinction
Results
Overview of npi framework
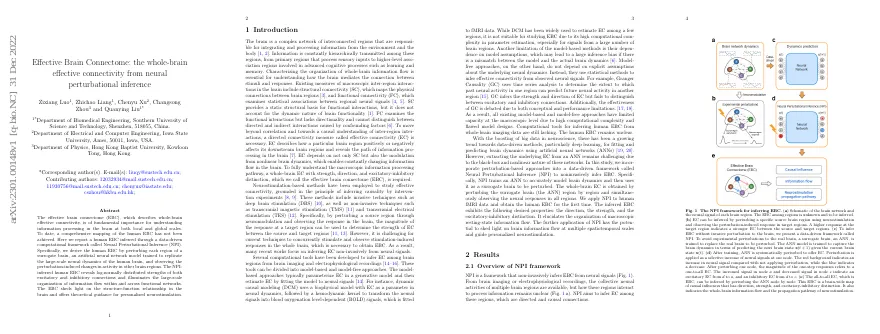
- NPI is a framework that infers EBC from neural signals
- Experimental methods such as DBS and TMS have been used to study EC in the brain
- NPI uses a data-driven approach to infer EC
- NPI uses an ANN as a surrogate brain to replace the real brain
- Perturbing each node in ANN offers the EBC which has strength, direction, and excitatory-inhibitory distinction
Npi-inferred ec reflects sc underlying synthetic data
- EC is constrained by SC
- SC describes physical wiring of brain
- EC measures functional influence between regions
- EC is modulated by other factors
- NPI used to infer EC from BOLD signals
- NPI compared to GC and DCM
- NPI had significantly higher AUC than GC and DCM
- Nonlinear neural mass model used to assess performance of NPI
- Ground-truth SC is directed and sampled from Gaussian distribution
- Network is fully connected with ground-truth SC as weighted connections
- Each node modeled as Wilson-Cowan oscillator
- Neural firing rates transformed into BOLD signals using HRF
- EC inferred by applying NPI to BOLD time series
- Pearson’s correlation coefficient used to measure performance
- NPI demonstrated significantly better performance than GC and DCM
- NPI performance remains robust as number of nodes increases
- Example of inference result for network with 50 regions shows strong correlation between ground-truth SC and inferred EC
Ann model predicts the human brain dynamics and characterizes the functional connectome
- Applied NPI to rsfMRI data from 800 subjects
- Brain parcellated using MMP atlas
- ANN model trained separately for each subject
- Predicted signals accurately reflected true neural signals
- Predicted signals used to compare functional connectivity of generated and empirical BOLD data
- ANN model accurately captures topography of resting-state functional networks
The human ebc inferred by npi
- Applied perturbations to ANN to measure response and infer EC
- Excitatory EC has higher density for ipsi-lateral connections, inhibitory EC has higher density for contra-lateral connections
- Degree of regions in binarized EBC calculated as mean of indegree and outdegree
- Indegree and outdegree are strongly correlated
- Distribution of connection strengths best fit by log-normal distribution
- Most connections in binarized EBC are bidirectional
The relationship of structural, functional and effective connectome of human brain
- EC is strongly correlated with both SC and FC
- SC and EC have a modular structure
- EC better explains SC than FC
- FC distinguishes positive and negative correlations
- Entries with strong EC tend to have strong FC
- IS is a better predictor of FC than OS and EC itself
Ebc uncovers information flow within and across large-scale brain networks
- Excitatory and inhibitory EC differ in distribution patterns
- Excitatory EC is more dense than inhibitory EC
- Excitatory EC is higher within functional networks, inhibitory EC is higher between them
- Seed-based EBC reveals network structure and how seed region inhibits other regions
- Strongest 15% of excitatory and inhibitory connections among networks reveal how they connect
- Excitatory EC follows information pathways, inhibitory EC concentrated in FPN and DMN
The information flow within and across dmn
- DMN is a brain network active during rest or spontaneous thought
- Involved in cognitive functions such as memory consolidation, social cognition, and information integration
- Mechanisms of DMN’s functions not fully understood
- Analyzed effective connectivity within and between DMN and other brain regions
- mPFC has weak inhibitory connections with other DMN regions
- Outflow and inflow of information across DMN regions depicted by EBC
Discussion
- Shift in understanding of brain from localized regions to distributed network
- Proposed data-driven framework to infer EBC with direction, strength, and distinction between excitatory and inhibitory connections
- Applied framework to resting-state human fMRI data to uncover macroscopic organization of excitatory and inhibitory connections
Npi is a general data-driven framework to infer causal relationship
- Perturbation is used to uncover causal relationships in complex systems
- NPI framework uses an ANN as a surrogate brain to be perturbed
- ANN was trained through one-step-ahead prediction
- Prediction performance of ANN was high (r2 = 0.988)
- ANN has good generalization ability
- Limitation of NPI is need for long time series to train ANN
The relationship between structural, functional, and effective brain connectome
- Central question in neuroscience is how static brain structure supports rich brain functionality
- SC typically obtained through brain imaging techniques, but does not capture directionality or excitatory/inhibitory nature of connections
- FC usually calculates correlation among neural signals, but does not describe information flow in the brain
- NPI proposed to infer EBC, which offers directed EC among brain regions
- EC is a composite effect that depends on SC, nonlinear brain dynamics, regional heterogeneity, and spatiotemporal scale of observation
- EBC strongly correlated with whole-brain SC
- FC is result of both similar EC inputs and direct EC
- EC better explains SC than FC
- Future research to investigate how SC and macroscopic brain dynamics interact to support EC
Insights from the human resting-state ebc
- Macroscopic information flow is important for connecting sensory inputs to cognitive functions
- NPI can be used to infer resting-state EBC from resting-state fMRI data
- Strength of connections in EBC follows a log-normal distribution
- NPI can distinguish between excitatory and inhibitory connections in EBC
- Excitatory connections are concentrated in local communities, while inhibitory connections have higher density across networks and hemispheres
- mPFC has inhibitory connections to other DMN regions and excitatory connections to hippocampus and cortex
Future applications of npi framework
- NPI is a versatile framework that can be used to study causal relationships in various contexts.
- NPI can be used to analyze data from multiple spatiotemporal scales.
- NPI can be extended to other types of data, such as traffic flow and social network data.
- NPI can aid in the selection of control nodes for personalized neurostimulation.
Methods
The npi framework
- NPI framework consists of two steps: training an ANN and applying perturbations to each input node
- ANN is a multi-layer perceptron with 379, 800, 1000, 1000, 800, 379 units and ReLU activation function
- ANN is trained by minimizing one-step-ahead prediction error
- Virtual perturbations are applied to each input node to infer EC of brain regions
- EC is expressed as strength of perturbation applied to region A
Linear generative model
- NPI was tested on a dataset with ground-truth ECs of 5-10 nodes
- ECs had strength of 0 or 1
- 9 EC structures and 10 simulations with different noise were used
- Generative process of dataset follows linear equation
- Neural signals transformed into BOLD signals with Balloon-Windkessel hemodynamic model
- Binarized ECs compared to two baseline methods (GC and spDCM)
- Classification accuracy and AUC compared with varying thresholds
Nonlinear generative model
- Nonlinear generative model is based on Wilson-Cowan model
- Model includes excitatory and inhibitory neural populations with varying number of nodes
- Long-range connections only exist among excitatory populations
- Strength of connections sampled from standard Gaussian distribution
- Neural signals transformed to BOLD signal through Balloon-Windkessel hemodynamic kernel function
- Pearson’s correlation coefficient used to compare NPI estimated EC and ground-truth EC
Hemodynamic equations
- Neural signals are transformed to BOLD signals using the Balloon-Windkessel hemodynamic model.
- Equations are used to calculate the BOLD signal, with parameters taken from previous studies.
Validation of npi with synthetic data
- Linear generative model has binary connections (0 or 1)
- Tested accuracy and AUC with 0.5 threshold
- Nonlinear generative model has continuously weighted connections
- Correlation between groundtruth and connections inferred from NPI, GC, and DCM
- spDCM is hard to use in networks with more than 50 regions
- Compared performance of NPI and GC in 10-300 dimensional networks
- Compared DCM in 10-dimensional case
Empirical data and the brain atlas
- HCP S1200 release includes rsfMRI data from 800 subjects
- Preprocessing of fMRI is based on MSMAII
- TR 0.72s for rsfMRI data
- 4 runs of 15-min rsfMRI per subject
- Brain parcellated into 360 cortical regions according to MMP 1.0 atlas
- Results replicated with AAL atlas with 116 regions
Construction of the whole-brain sc, fc and ec
- Preprocessed resting-state fMRI time series using HCP minimal preprocessing pipeline
- Denoised data using ICA-FIX
- Extracted data at 0.1 to 0.01 Hz using nilearn
- Calculated FC as Pearson’s correlation coefficient between time series of each pair of brain regions
- Used structural connectivity constructed by Demirtaş et al.
- SC matrix scaled between 0 and 1
- EC obtained from NPI framework trained using four runs of fMRI of each subject
Parcellation of functional networks
- Parcellated 360 cortical regions are assigned to seven functional networks
- Visual network (VIS), somatomotor network (SOM), dorsal attention network (DAN), ventral attention network (VAN), frontoparietal control network (FPN), and default mode network (DMN)
- Each region is assigned to the functional network with the largest number of voxels
- Seed placed in left-hemisphere core brain region of each of the seven functional networks
- Seed-based FC calculated using Pearson’s correlation between seed region and rest regions
- Limbic network excluded from seed-based plots
Ec between dmn and other cortical and subcortical regions
- Analyze the effective brain connectivity (EC) within and between core regions in the default mode network (DMN)
- Use a data-driven framework called NPI to infer EC without invasive perturbation to the brain
- Perturb a surrogate brain, an artificial neural network (ANN), to offer EC
- NPI-inferred EC better reflects structural connectivity (SC) than baseline models
- Use ANN to predict human BOLD signals and characterize the functional connectome
- Averaged EC of 800 subjects with regions organized according to functional networks
- Strength of SC and EC strongly correlated
- Strength of FC and EC strongly correlated
- Input similarity (IS) of two regions and FC strongly correlated
- Average excitatory and inhibitory EC density within and between functional brain networks
- EC among core DMN regions depicted, with excitatory EC in red and inhibitory EC in blue
- Variability of EC among subjects measured by calculating the standard deviation
- Inflow and outflow of information across core DMN regions
- NPI performs significantly better than GC and DCM
- Performance of NPI slightly decreases with increasing observational noise
- Performance of NPI reliable with increasing variations of hemodynamic response functions (HRF)
- Performance of NPI with increasing perturbation strength
- Performance of NPI with varying data length and number of nodes
- Response of brain regions to perturbation depends on timing of perturbation
- EBC, binarized EBC, and excitatory and inhibitory part of EBC