Link to paper
The full paper is available here.
You can also find the paper on PapersWithCode here.
Abstract
- A framework for performing valid statistical inference when an experimental data set is supplemented with predictions from a machine-learning system
- No assumptions are made on the machine-learning algorithm
- Higher accuracy of predictions leads to smaller confidence intervals
- Algorithms for computing valid confidence intervals for statistical objects
- Demonstrated with data sets from proteomics, genomics, electronic voting, remote sensing, census analysis, and ecology
Paper Content
Introduction
- Machine-learning algorithms are used to make predictions
- Predictions can be used to generate predictions for entities not studied experimentally
- Examples of predictions include molecular activity, tumor prognoses, and microclimatic modeling
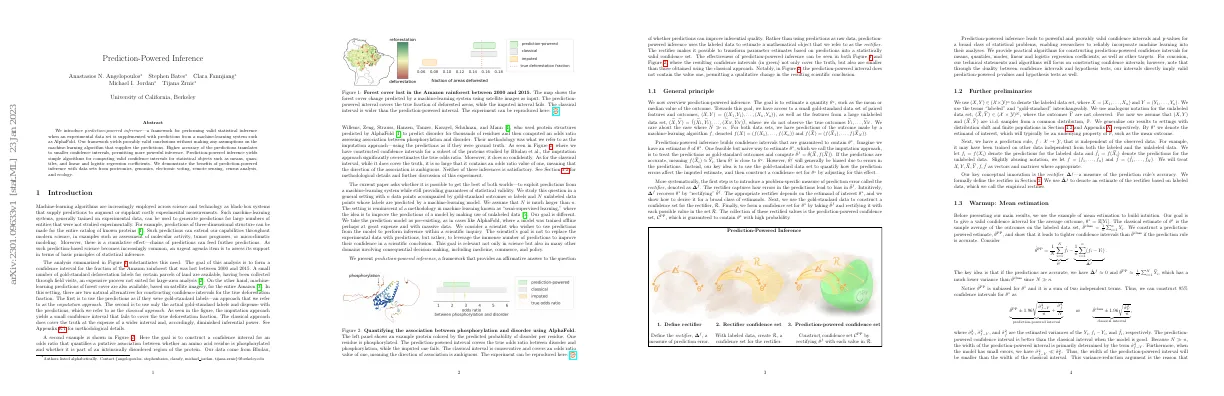
- Analysis was done to form a confidence interval for the fraction of the Amazon rainforest lost between 2000 and 2015
- Gold-standard labels were collected through field visits, an expensive process
- Machine-learning predictions of forest cover were also available, based on satellite imagery
- Two natural alternatives for constructing confidence intervals were used
- Imputation approach yields a small confidence interval that fails to cover the true deforestation fraction
- Classical approach covers the truth at the expense of a wider interval
- Second example used to construct a confidence interval for an odds ratio between phosphorylation and disorder
- Imputation approach significantly overestimates the true odds ratio
- Prediction-powered inference framework provides an affirmative answer to the question of whether predictions can improve inferential quality
- Confidence intervals cover the truth and are smaller than those obtained using the classical approach
General principle
- Goal is to estimate a quantity θ*
- Have access to small gold-standard data set and large unlabeled data set
- Use predictions from machine-learning algorithm to estimate θ*
- Introduce problem-specific measure of prediction error called rectifier, ∆f
- Use gold-standard data to construct confidence set for rectifier, R
- Construct confidence set C PP by rectifying θf with each value in R
- Confidence intervals and p-values for a broad class of statistical problems
Further preliminaries
- Labeled data set is denoted as (X, Y) ∈ (X ×Y) n
- Unlabeled data set is denoted as ( X, Y ) ∈ (X × Y) N
- Data sets are assumed to be i.i.d. samples from a common distribution, P
- Estimand of interest is denoted as θ*
- Prediction rule is denoted as f : X → Y
- Rectifier is a measure of the prediction rule’s accuracy
- Empirical rectifier is an estimate of the rectifier based on labeled data
Warmup: mean estimation
- Goal is to give valid confidence interval for average outcome
- Classical estimate of average outcome is sample average of labeled data set
- Prediction-powered estimate leads to tighter confidence intervals if prediction rule is accurate
- Prediction-powered confidence interval is better than classical interval when model is good
Related work
- Related to inference under misspecification
- Leverages auxiliary data to improve inference from surveys
- Mean estimator in Section 1.3 is the difference estimator
- Predictive models fit on separate data
- Handles wider range of estimands
- Related to semisupervised learning and missing data literature
Main theory: convex estimation
- Our main contribution is a technique for inference on estimands that can be expressed as the solution to a convex optimization problem.
- We consider estimands of the form for a loss function θ : X × Y → R that is convex in θ ∈ R p.
- We define a rectifier to capture a notion of prediction error.
- We create a confidence set for the rectifier.
- We form a confidence set for θ * by combining the rectifier confidence set with a term that accounts for finite-sample fluctuations.
- We present a valid confidence set for θ * without assumptions about the data distribution or the machine-learning model.
Algorithms
- Mean estimation algorithm and guarantee
- Quantile estimation algorithm and guarantee
- Logistic regression algorithm and guarantee
- Linear regression algorithm and guarantee
- Algorithms rely on confidence intervals derived from the central limit theorem
- Mean estimation expressed as minimizer of average squared loss
- Quantile estimation expressed as solution to variational form
- Logistic regression target of inference defined by logistic loss
- Linear regression natural estimator is linear in Y
- Algorithms use z 1−δ to denote 1 − δ quantile of standard normal distribution
Applications
- Demonstrated prediction-powered inference on real tasks
- Computed prediction-powered confidence interval and compared to two alternatives
- Showed that imputed interval does not account for prediction errors
- Compared widths of prediction-powered and classical intervals
- Studied audits of electronic voting in an election with two candidates
- Constructed confidence interval for proportion of people voting for each candidate
- Used optical ballot labeling system and small number of ballots labeled by hand
- Used Algorithm 1 to construct prediction-powered confidence interval
- Prediction-powered interval has roughly 1/4 the width of classical counterpart
- Imputed interval is invalid, does not cover ground truth
Relating protein structure and post-translational modifications
- Demonstrate how prediction-powered confidence intervals can be used to construct confidence intervals for the odds ratio
- Goal of analysis is to characterize the structural context of post-translational modifications (PTMs)
- Bludau et al. studied the relationship between PTMs and IDRs on a proteome-wide scale
- Used AlphaFold-predicted structures to predict IDRs
- Constructed 1-α/2 prediction-powered confidence intervals for µ 0 and µ 1
- By union bound, C PP contains θ* with probability at least 1-α
- Used census data to investigate the quantitative effects of age and sex on income
- Used XGBoost to impute predictions and Algorithm 4 to construct intervals
- Used census data to study the effect of income on the procurement of private health insurance
- Used Algorithm 3 to construct intervals
- Used prediction-powered confidence intervals on quantiles to study the effects of regulatory DNA on gene expression
- Used XGBoost to impute predictions and Algorithm 2 to construct intervals
- Used Imaging FlowCytobot to count plankton
- Used label shift technique to construct prediction-powered confidence interval on frequency of observed plankton
- Propagated confidence interval into a count
Extensions
- Prediction-powered inference can be applied to settings beyond i.i.d. convex estimation
- Strategy for prediction-powered inference when θ * is the optimum of any optimization problem
- Prediction-powered inference under certain forms of distribution shift
Beyond convex estimation
- Tools developed in Section 2 tailored to unconstrained convex optimization problems
- Inferential targets can be defined in terms of nonconvex losses or have nonconvex constraints
- Generalized approach to broad class of risk minimizers
- Problem subsumes all previously studied settings
- Solution handles problems of the form (8) in full generality
- Additional step of data splitting needed
- Theorem 2 applies to discrete and continuous cases, Tukey’s biweight robust mean, and model selection
Inference under distribution shift
- We focus on forming prediction-powered confidence intervals when the labeled and unlabeled data come from different distributions.
- We handle all estimation problems previously studied for covariate shift and certain types of linear problems for label shift.
- We assume that the unlabeled data defines the target of inference θ*.
- We assume that the distributions are related by either a label shift or a covariate shift.
- We use the Radon-Nikodym derivative to relate risk minimizers on Q to risk minimizers on P.
- We explain the approach in detail for convex risk minimizers.
- We use the confusion matrix to estimate the label shift.
- We provide corollaries for mean, quantile, and logistic regression estimation.
- We note that linear regression can also be used, but it is not recommended in practice.
B.3 regularity conditions
- Algorithms rely on confidence intervals derived from the central limit theorem
- Require two quantities to have at least the first two moments
- Weak conditions for classical linear regression intervals to cover the target
- Data points labeled as one of {deforestation, no deforestation}
- Train a histogram-based gradient boosting tree to predict deforestation labels
- Use Corollary A.1 and Proposition D.4 to produce confidence intervals
- Standard binomial confidence interval for imputation approach
E.2 relating protein structure and post-translational modifications
- Model for predicting disorder: logistic regression model maps relative solvent-accessible surface area to probability of disorder