Link to paper
The full paper is available here.
You can also find the paper on PapersWithCode here.
Abstract
- Current Deep Network visualization and interpretability methods rely on data space visualizations.
- SplineCam is the first provably exact method for computing the geometry of a DN’s mapping.
- SplineCam applies to any DN architecture based on CPWL nonlinearities.
- SplineCam enables comparison of architectures, measuring generalizability and sampling from the decision boundary.
Paper Content
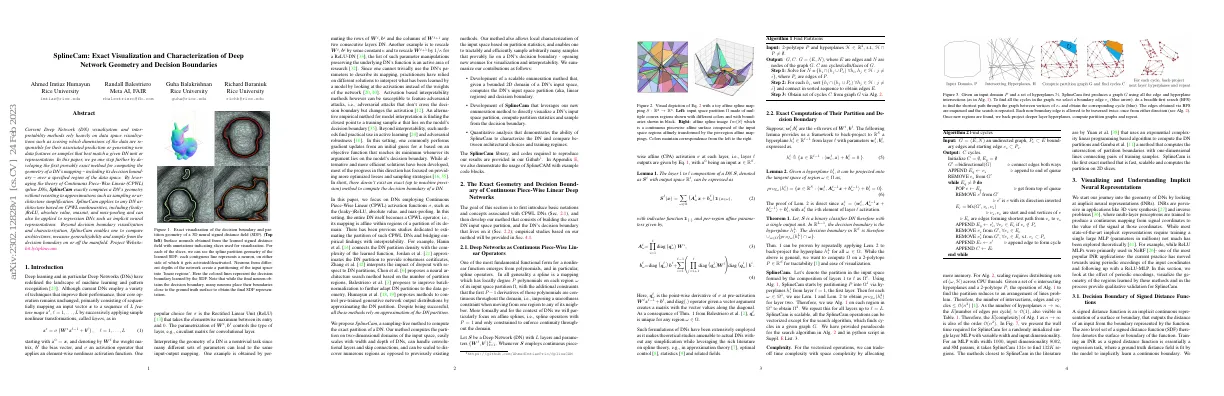
Introduction
- Deep learning and in particular Deep Networks (DNs) have redefined machine learning and pattern recognition
- DNs employ a variety of techniques to improve performance
- DNs consist of sequentially mapping an input vector to a sequence of feature maps
- Weight matrix, bias vector and activation operator control the type of layer
- Rectified Linear Unit (ReLU) is a popular choice for activation operator
- Interpreting the geometry of a DN is a nontrivial task
- Activation based interpretability methods can be susceptible to feature adversarial attacks
- Finding closest point to a training sample that lies on the model’s decision boundary is an empirical method for model interpretation
- Continuous Piece-Wise Linear (CPWL) activation functions are used in DNs
- SplineCam is a sampling-free method to compute the exact partition of a DN
- SplineCam can visualize a DN’s input space partition, compute partition statistics and sample from the decision boundary
The exact geometry and decision boundary of continuous piece-wise linear deep networks
Deep networks as continuous piece-wise linear operators
- Spline operators are a form of nonlinear function
- Each region of the input space has a degree P polynomial
- The first P-1 derivatives of the polynomials are continuous
- DNs with CPA activation can be expressed as a spline
- Spline theory has been used in approximation theory, optimal control, and statistics
Exact computation of their partition and decision boundary
- Suppose w and b are rows of W and b.
- Lemma 2 provides a framework to back-project a hyperplane from layer with parameters w and b.
- Theorem 1 states that the decision boundary in R S is the union of the projection of the hyperplane onto the tangent space of region ω.
- SplineCam partitions P into Ω 1 via hyperplanes h 1 i from layer 1.
- For each ω in Ω 1, Lemma 1 and Lemma 2 are used to obtain proj ω (h 2 i) for layer two.
- SplineCam is scalable and vectorized except for the search algorithm.
- The number of intersections, edges and cycles is ≤ O(n2).
Visualizing and understanding implicit neural representations
- INRs are used in 3D view synthesis and inverse problems
- MLPs are trained to produce a continuous mapping from signal coordinates to the value of the signal
- ReLU MLPs are used in NeRF, a popular INR application
- Current practice uses periodic encodings of the input coordinates and a ReLU-MLP
- Visualize the geometry of the regions learned by these methods
Decision boundary of signed distance functions
- We train an INR as a 2D SDF using an image from the MetFaces dataset.
- We create two binary images and use them to create separate ground truth SDFs.
- We train an identical ReLU-MLP architecture on both ESDF and HSDF.
- The network creates more regions with higher density for the harder HSDF task.
The effect of positional encoding on inr geometry
- INRs trained with periodically encoded coordinates can fit input signals better and faster
- Little theoretical investigation of how positional encoding affects learning
- ReLU-MLP used as INR backbone
- Piecewise approximation of sine/cosine used while training
- Periodic wrapping of space induced by P.E. increases number of regions and weight sharing across input space
How training hyper-parameters impact your spline
- DNs with CPWL nonlinearities are CPWL mappings or affine splines.
- Properties of affine splines can be used to measure complexity of a function.
- This section proposes a quantitative approach to using SplineCam to measure how different training choices impact the partition of the DN.
Impact of architecture on partitions properties
- Computing the exact partition boundary has many applications.
- Choice of architecture can have a significant effect on the partitioning induced by a deep neural network.
- Quantifying the characteristics of the partitions involves measures such as Average Region Volume, number of vertices, Number of Regions, and eccentricity.
- Convolutional architectures have a significantly higher number of partition regions, smaller eccentricity and volume of the polytopes, and higher partition density.
Data-augmentation
- Data-Augmentation is a technique used to improve the performance of Deep Neural Networks
- An empirical study has been conducted to understand the impact of Data-Augmentation on Deep Neural Networks
- SplineCam was used to quantify the changes within a Deep Neural Network when Data-Augmentation is applied
- Results show that the average number of regions more than doubles between VGG11 and VGG16
Conclusions
- We present a method to visualize and sample the decision boundary of deep neural networks.
- We can use this method to gain insights into neural network geometries.
- We can use this method to provide improved initialization or pruning schemes.
- We can use this method to visualize the decision boundary dynamics of neural networks.
- We use Pytorch and Graphtool for implementation.
- We assess the computational complexity of SplineCam.
- We vary the width of a single layer MLP.
- We vary the area of the input domain.
- We train an 8 layer CNN with 6 convolutional layers and 2 fully connected layers.
- We provide SplineCam as a python toolbox.
- We define a 2D input space region of interest.
- We use a search algorithm to find cycles from a given graph.
- We visualize the exact decision boundary of a 3D neural signed distance field.
- We visualize the affine spline mapping.
- We visualize the ANR distribution.
- We visualize the evolution of ARV with training epochs.
- We visualize the decision boundary of a 5 layer convnet.