Link to paper
The full paper is available here.
You can also find the paper on PapersWithCode here.
Abstract
- XAI methods can explain predictions of DNNs
- XAI methods have been applied in climate science
- Missing ground truth explanations complicate evaluation and validation of XAI methods
- This work introduces XAI evaluation in the context of climate research
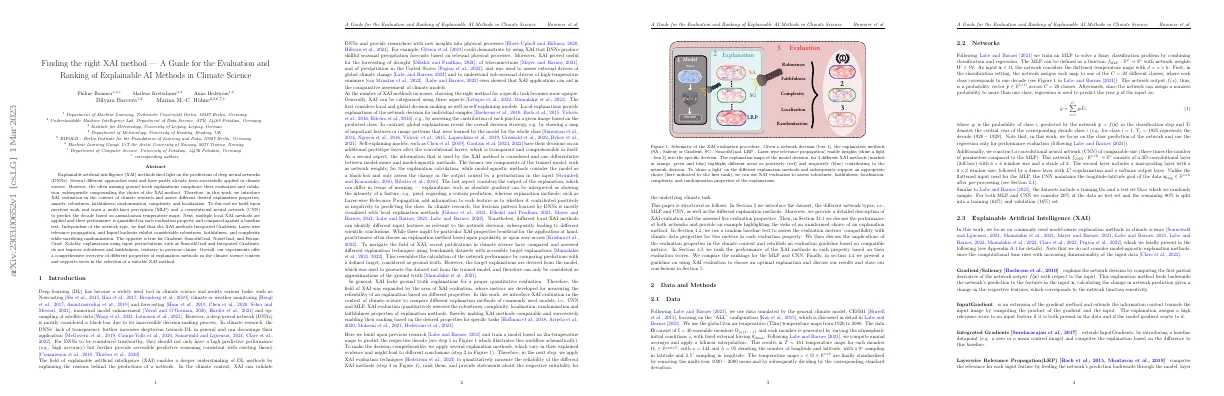
- Evaluation properties assessed: robustness, faithfulness, randomization, complexity, localization
- MLP and CNN trained to predict decade based on temperature maps
- Multiple XAI methods applied and performance quantified for each evaluation property
- XAI methods Integrated Gradients, Layer-wise relevance propagation, and InputGradients show considerable robustness, faithfulness, and complexity
- Explanations using input perturbations do not improve robustness and faithfulness
Paper Content
Introduction
- Deep learning is used in climate science for tasks such as nowcasting, monitoring, forecasting, model enhancement, and upsampling of satellite data
- Deep neural networks are considered a black box and lack transparency
- Explainable artificial intelligence (XAI) can validate DNNs and provide researchers with new insights
- XAI can be categorized using three aspects: local/global decision-making, self-explaining models, and model-aware/model-agnostic methods
- Output of XAI can differ in terms of meaning
- XAI evaluation quantitatively assesses the reliability of an explanation
- XAI evaluation properties include robustness, complexity, localization, randomization, and faithfulness
- Workflow includes training a model, applying XAI methods, and using XAI evaluation to compare and rank methods
- Evaluation metrics are assessed for compatibility with climate data properties
- Guideline established for using XAI evaluation to choose an optimal explanation
Data and methods
Data
- Data is simulated by the general climate model, CESM1
- Data consists of 40 ensemble members
- Data is global 2-m air temperature maps from 1920 to 2080
- Data is processed by computing annual averages and applying a bilinear interpolation
- Data is standardized by removing the multi-year 1920-2080 mean and dividing by the corresponding standard deviation
Networks
- MLP and CNN are trained to solve a fuzzy classification problem
- MLP takes flattened temperature maps as input
- MLP assigns each map to one of 20 different classes
- Regression is used to predict the year of the input
- MLP and CNN have comparable number of parameters
- Datasets include a training and test set, 80% of data is split into training and validation set
Explainable artificial intelligence (xai)
- Model-aware explanation methods in climate science are presented
- Model-agnostic explanation methods are not considered due to computational time
- Gradient/Saliency explains network decision by computing first partial derivative of output with respect to input
- InputGradient extends information content towards input image
- Integrated Gradients introduces baseline datapoint and computes explanation based on difference to baseline
- Layerwise Relevance Propagation computes relevance for each input feature by feeding network’s prediction backwards
- SmoothGrad, NoiseGrad, and FusionGrad perturb input features and/or network weights to account for uncertainties
Evaluation techniques
- XAI research has developed metrics to assess different properties of explanation methods
- Five different evaluation properties have been analyzed, based on a classification task from Labe and Barnes [2021]
Faithfulness
- Table 5 refers to a perturbation function called ‘Indices’
- ‘Indices’ refers to the replacement of the highest value pixels in the explanation
- ‘Linear’ refers to noisy linear imputation
Randomisation
- Calculations for MPT score use ‘bottom up’ approach from output layer to input layer
- Pearson correlation used as similarity function for both metrics
- Top-k considers 10% most relevant pixels of all pixels in temperature map
- Hyperparameters of XAI methods and evaluation metrics reported in Tables 4 and 5 respectively
- Maximum and minimum values of temperature maps in dataset denoted as xmax and xmin
Localisation
- Quality of an explanation is measured based on agreement with user-defined region of interest
- Localization metrics assume that ROI should be mainly responsible for network decision
- Top-k-pixel and relevance-rank-accuracy are used to measure localization
- Complexity assesses how evidence values are distributed across explanation map
Complexity
- Complexity is a measure of conciseness
- Explanations should consist of few strong features
- Complexity and sparseness are used as metric functions
- Low entropy is desirable
Network predictions, explanations and motivating example
- Evaluated network performance and discussed application of explanation methods for both network architectures
- Fixed hyperparameters and fuzzy classification setup for MLP and CNN during training
- MLP and CNN have similar performance compared to primary publication
- Classification accuracy of both networks agrees within error bounds
- Calculated explanation maps for all temperature maps correctly predicted
- Applied XAI methods to explain predictions of both MLP and CNN
- Different XAI methods provide different relevances
Assessment of xai metrics
- Evaluated XAI evaluation properties for classification task on MLP
- Analyzed two representative metrics for each property
- Based analysis on three criteria: coherence, score stability, and information value
- Provided artificial random explanation baseline for each metric
- Robustness metrics pass random baseline test
- LRP-α-β has highest robustness scores
- FusionGrad and NoiseGrad have lowest robustness scores
- AS and LLE scores do not align
- FC passes random baseline test, ROAD scores of NoiseGrad and FusionGrad overlap with random baseline
- MPT and RL metrics evaluated, random baseline has lowest scores
- Complexity and Sparseness metrics evaluated, LRP-α-β has highest complexity score, InputGradients and LRP-z have highest sparseness scores
- Localization metrics evaluated, FusionGrad has highest score, all other explanation methods have lower but similar scores
Network-based comparison
- MLP and CNN networks compared using one metric per property
- Challenges in defining meaningful ROI for localization and defining localization as an explanation property
- Table 3 displays results for both networks across all properties
- Similarities in ranking across every category, but differences in localization and complexity due to structural differences in learned patterns
- Input contribution methods (Integrated Gradients, Input-Gradients, LRP) best in faithfulness, robustness, and complexity
- Gradient-based methods (Gradient, SmoothGrad, NoiseGrad, FusionGrad) best in randomization
- LRP-α-β and LRP-composite low rankings in faithfulness category
- Explanation-enhancing procedures (SmoothGrad, Integrated Gradients, FusionGrad, NoiseGrad) no improvement of explanation performance
- Spyder plot (Table 3 and Figure 8) used to determine best-performing XAI method
Choosing a xai method
- XAI evaluation can be used to select an appropriate XAI method.
- Practitioners should determine which explanation properties are essential for their specific network task.
- XAI evaluation scores can be used to rank XAI methods and determine the optimal one for the given task.
Discussion and conclusion
- XAI methods aim to improve understanding of complex relationships learned by DNNs
- XAI methods can provide novel insights into climate AI research
- Increasing number of available XAI methods raises two questions: Which explanation method is trustworthy and which is an appropriate choice for a given task?
- XAI evaluation introduced to climate science to address these questions
- Evaluate various local, model-aware explanation methods
- Evaluate based on five different properties: robustness, faithfulness, randomization complexity, localization
- Normalized evaluation scores across properties calculated for different XAI methods
- Results indicate that explanation methods considering input contributions perform better
- XAI evaluation facilitates more trustworthy interpretation of explained evidence
- XAI evaluation offers thorough and novel information about structural properties of explanation methods
- XAI evaluation guideline proposed to choose optimal explanation method for specific research task
- Robustness score affected by increased data and network noise
- Explainations using averages across perturbations do not increase robustness, faithfulness and complexity
- Gradient-based methods capture network parameter influence more reliably